
Liquidity Dashboard Pro
See what’s driving global liquidity, not just the headline
The Global Liquidity Index is free. Pro shows you everything behind it: all 112 charts across the Fed, the ECB, the Bank of England, the Bank of Japan, the PBoC and markets, a weekly note on what liquidity is doing, an email when its momentum turns, and an MCP connector to use it all in Claude or ChatGPT.
US$20 a month after 10 free days. Cancel any time before then and you pay nothing.
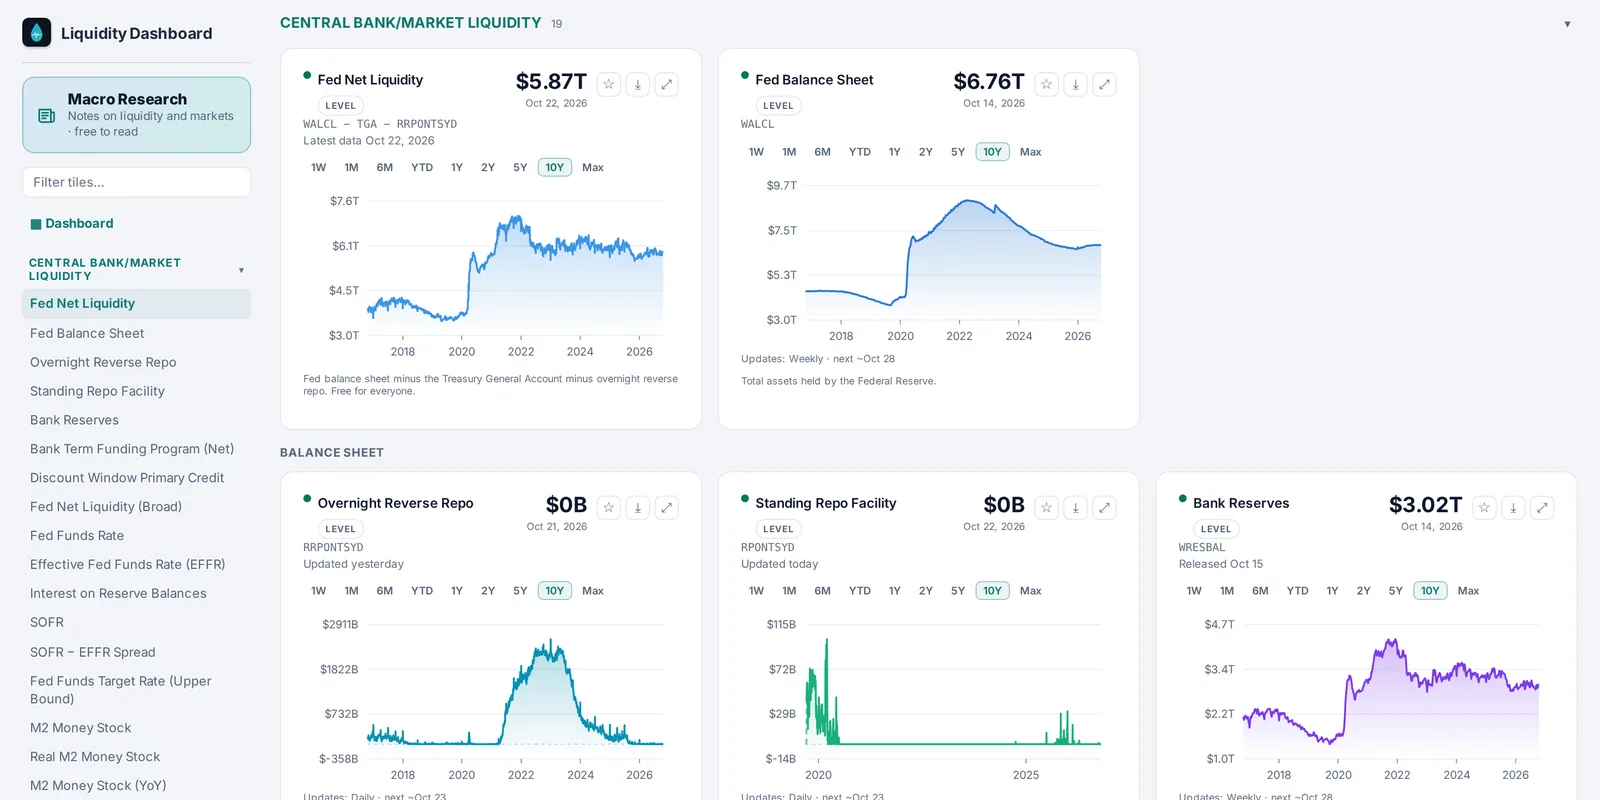
What you get with Pro
Fed balance sheet, bank reserves and repo, policy rates, yield curves, credit spreads, inflation, jobs and growth, plus every major central bank, FX, volatility, commodities and Middle East oil flows. 104 of them are only in Pro.
Pro includes an MCP connector. Add it once to Claude, ChatGPT or any app that supports MCP, then ask about liquidity, central banks and markets in plain English. It reads the data behind the charts (106 with live data feeds) and the full research, and can’t change anything. How to connect.
Every week: what the Global Liquidity Index did, what drove it and how markets have moved alongside it. Free readers get the first two paragraphs.
An email when the 13-week momentum of global liquidity turns, so you don’t have to check the chart every day.
Global liquidity next to the Nasdaq 100, Bitcoin and gold, with a lead/lag slider and the correlation over any range you pick.
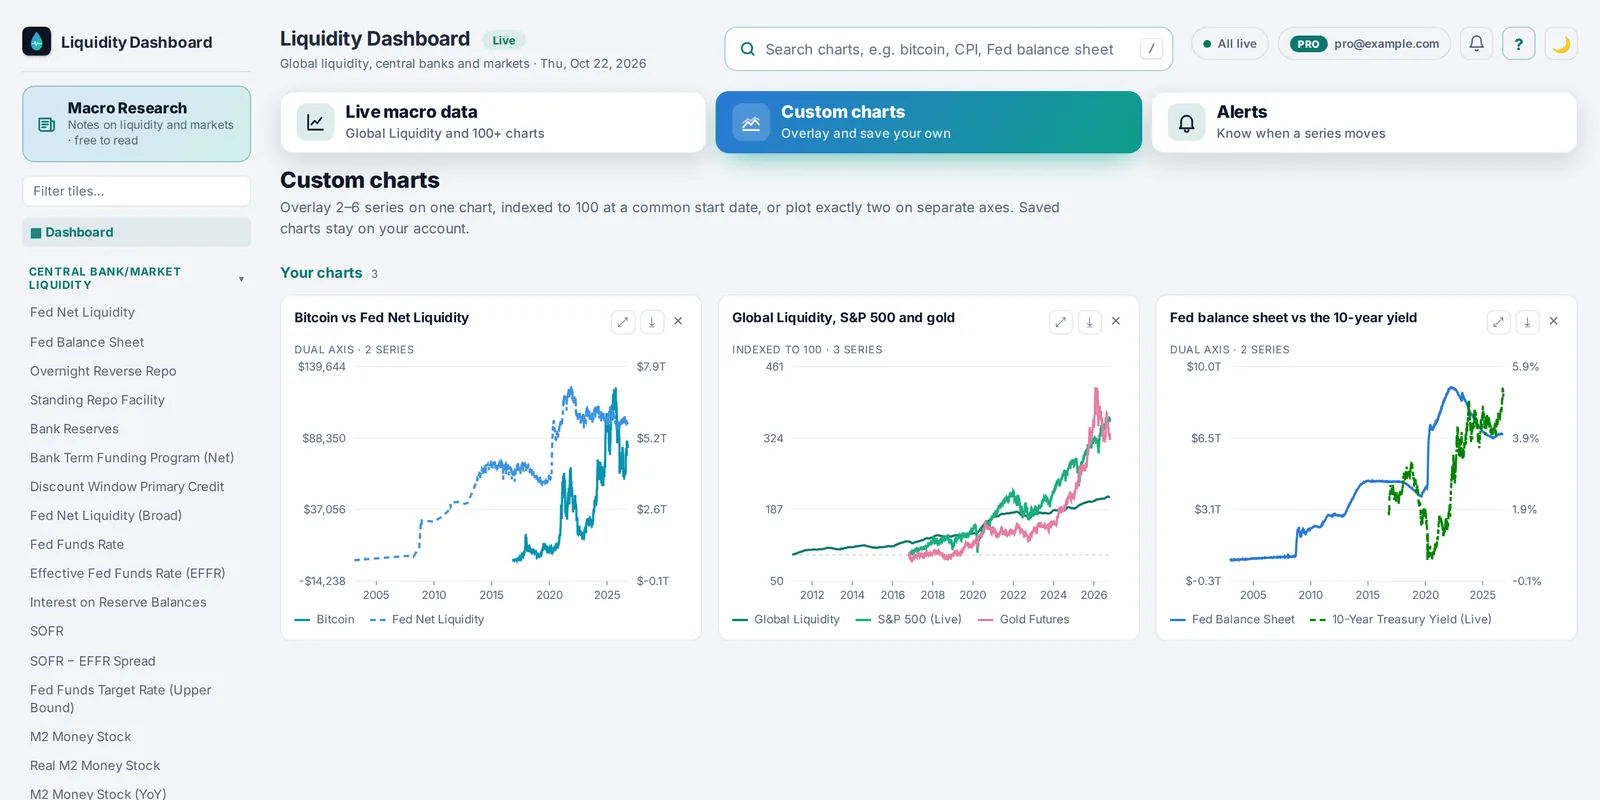
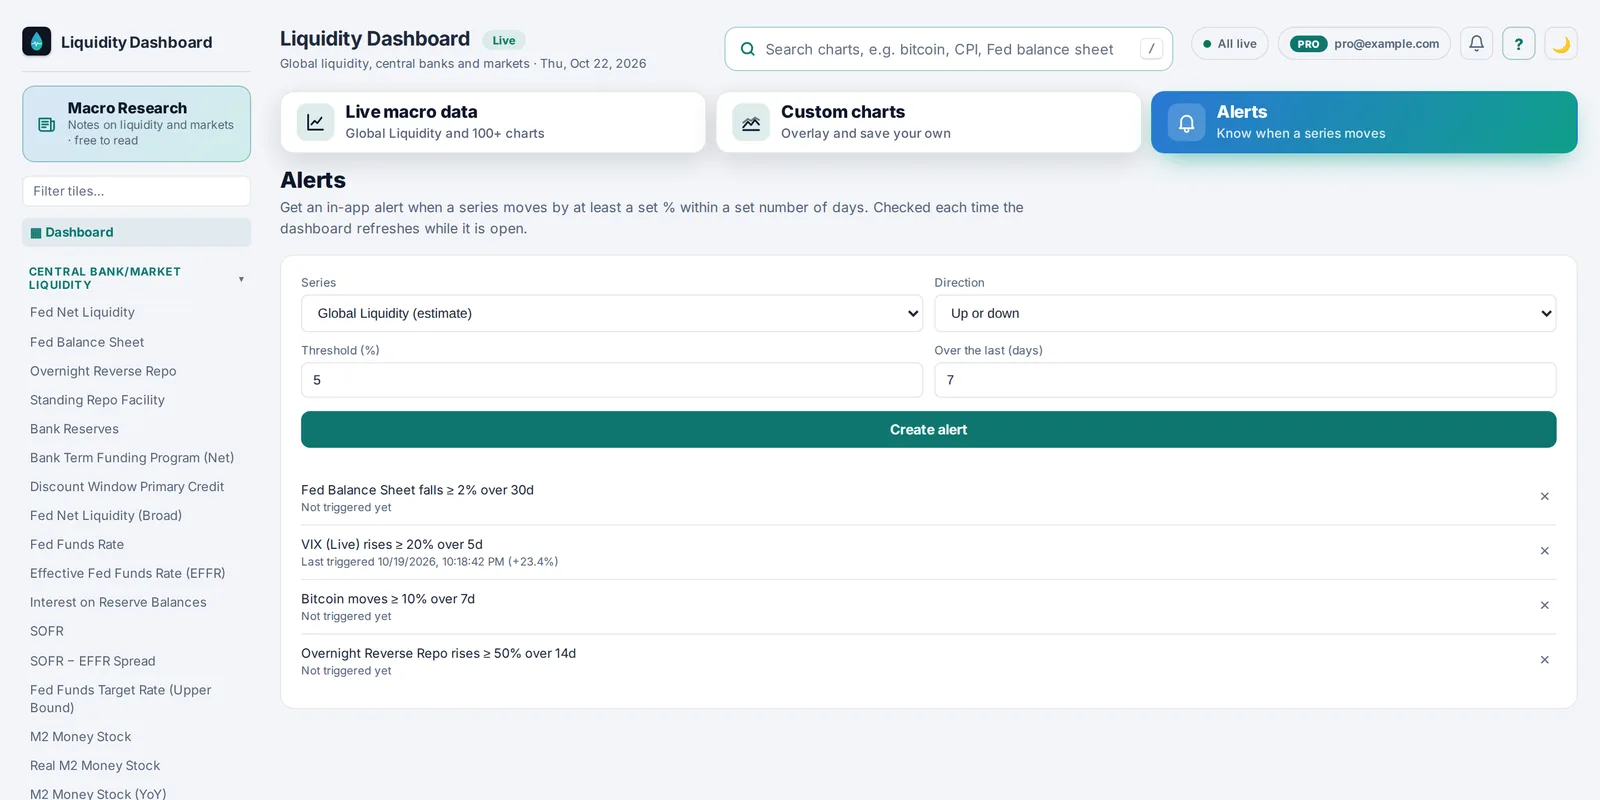
Overlay any series, shift one ahead of another and switch to a log scale. Alerts when a chart moves by the amount you choose, a webhook relay to your own systems, and PNG, SVG, CSV and JSON downloads.
Use Pro in Claude, ChatGPT and other AI apps
Pro includes an MCP connector. Add https://liquiditydashboard.net/mcp/pro to Claude, ChatGPT or any app that supports MCP, sign in and approve it, then ask about global liquidity, central banks and markets in plain English. Your AI app reads the data behind the charts (106 with live data feeds) and the full weekly note and research. It’s read-only: it can’t change anything or see your billing, and you can disconnect it any time in Settings.
How to connect, step by step →
Free and Pro side by side
| Feature | Free | Pro |
|---|---|---|
| Global Liquidity Index and Fed Net Liquidity | ✓ | ✓ |
| AI positioning assistant | ✓ | ✓ |
| Charts | 8, one on each tab | All 112 |
| Weekly liquidity note | The opening, by email | In full |
| Email when liquidity’s momentum turns | – | ✓ |
| Liquidity vs Nasdaq, Bitcoin and gold | – | ✓ |
| AI connector (MCP) for Claude, ChatGPT and other apps | Headline numbers | Data behind 106 charts, full research |
| Custom charts, alerts and webhook relay | – | ✓ |
| PNG and CSV downloads | ✓ | ✓ |
What’s inside
Every central bank tab has its balance sheet, policy rates, bond yields and the economic data that moves them. Here’s how the 112 charts split up:
| Section | Charts | For example |
|---|---|---|
| Federal Reserve & US economy | 54 | Overnight Reverse Repo, Standing Repo Facility, Bank Reserves, Bank Term Funding Program (Net) |
| European Central Bank & eurozone economy | 6 | ECB Deposit Facility Rate, ECB Main Refinancing Rate, Eurozone Inflation (HICP, YoY), Eurozone Real GDP (YoY) |
| Bank of England & UK economy | 4 | UK SONIA Rate, UK Unemployment Rate, UK Real GDP (YoY) |
| Bank of Japan & Japanese economy | 5 | BOJ Total Assets, Japan Call Money Rate, Japan Unemployment Rate, Japan Real GDP (YoY) |
| People's Bank of China & Chinese economy | 10 | China M2 Money Supply, China CPI (YoY), China FX Reserves, China Govt Budget Expenditure |
| Macro markets: equities, vol, commodities, FX | 19 | US Dollar Index, Bitcoin, Nasdaq 100, VIX (Live) |
| Iran War Oil Activity: Middle East oil exports | 14 | Middle East Oil Exports, WTI Crude Oil (Spot), Brent − WTI Spread, European Gas (Dutch TTF) |
See every chart and what it shows →
Pricing
Free for the first 10 days. You add a card when you start, and nothing is charged until the trial ends. We email you 3 days before. Cancel any time in Settings, then Billing & subscription.
Start free trialEverything in Pro for a team, faster refresh, priority support, custom series and onboarding.
Contact usQuestions
Is there a free trial?
Yes. Pro is free for 10 days. You add a card when you start, nothing is charged until the trial ends, and we email you 3 days before it does. Cancel before then and you pay nothing.
How much does Pro cost?
US$20 a month after the free trial. Prices are in US dollars.
What do I get without paying?
The Global Liquidity Index, Fed Net Liquidity, the AI positioning assistant, 8 charts (one on each tab) and the opening of the weekly note by email with a free account. Pro unlocks the other 104 charts and everything else on this page.
Can I use Liquidity Dashboard in Claude or ChatGPT?
Yes. Pro includes an MCP connector. Add https://liquiditydashboard.net/mcp/pro as a custom connector in Claude, ChatGPT or another app that supports MCP, then sign in and approve it. You can then ask about any chart in plain English, and the app reads the data behind it (106 charts with live data feeds) and the full research. It’s read-only, and you can disconnect it any time in Settings. Step-by-step guide.
Where does the data come from?
FRED (the Federal Reserve, the U.S. Treasury, the Bureau of Labor Statistics, the Bureau of Economic Analysis and others), the ECB, the Bank of Japan, the BIS, the U.S. Energy Information Administration, the Institute for Supply Management, Yahoo Finance, chinadata.live, CrossBorder Capital and Vortexa. Every chart names its sources, and each one updates when its source publishes. Full list of sources.
Can I cancel any time?
Yes. Go to Settings, then Billing & subscription, then Cancel. You keep Pro until the end of the period you’ve paid for, or the end of the trial, and you’re not charged again.
Is this financial advice?
No. Everything on the site is general information. Data can be delayed, revised or wrong, so check important figures with the original source.
Try Pro free for 10 days. All 112 charts, the weekly note in full, momentum alerts, custom charts and the MCP connector for Claude and ChatGPT. Cancel before day 10 and you pay nothing.
Start free trialGeneral information only, not financial advice. Data can be delayed, revised or wrong. Sources and credits.