Liquidity Dashboard
Macro Research Dashboard Start free trialTry free

Track global liquidity in one dashboard

A free daily Global Liquidity Index from 5 central banks plus G7 and China debt. Pro adds 100+ macro charts, CrossBorder Capital data, custom charts, alerts and an MCP connector for Claude and ChatGPT.

Start 10-day free trial Explore the free dashboard

No charge for 10 daysCancel any time

See the live chart ↓
Global LiquidityFree
Central banks + G7 and China government debt
$194.85T
as of Nov 2, 2026
Loading live data…
Central banks $21.68TFed $5.40TECB $4.37TBoJ $3.38TPBoC $7.45TBoE $1.08TG7 + China government debt $75.58T
Fed Net LiquidityFree
WALCL − TGA − RRP
$5.73T
Oct 30, 2026

Pro

What the index means, every week

A short weekly note on what global liquidity is doing, an email when its momentum turns, and charts comparing it with Bitcoin, the Nasdaq and gold. Plus all 112 charts from 10 sources. Free for 10 days.
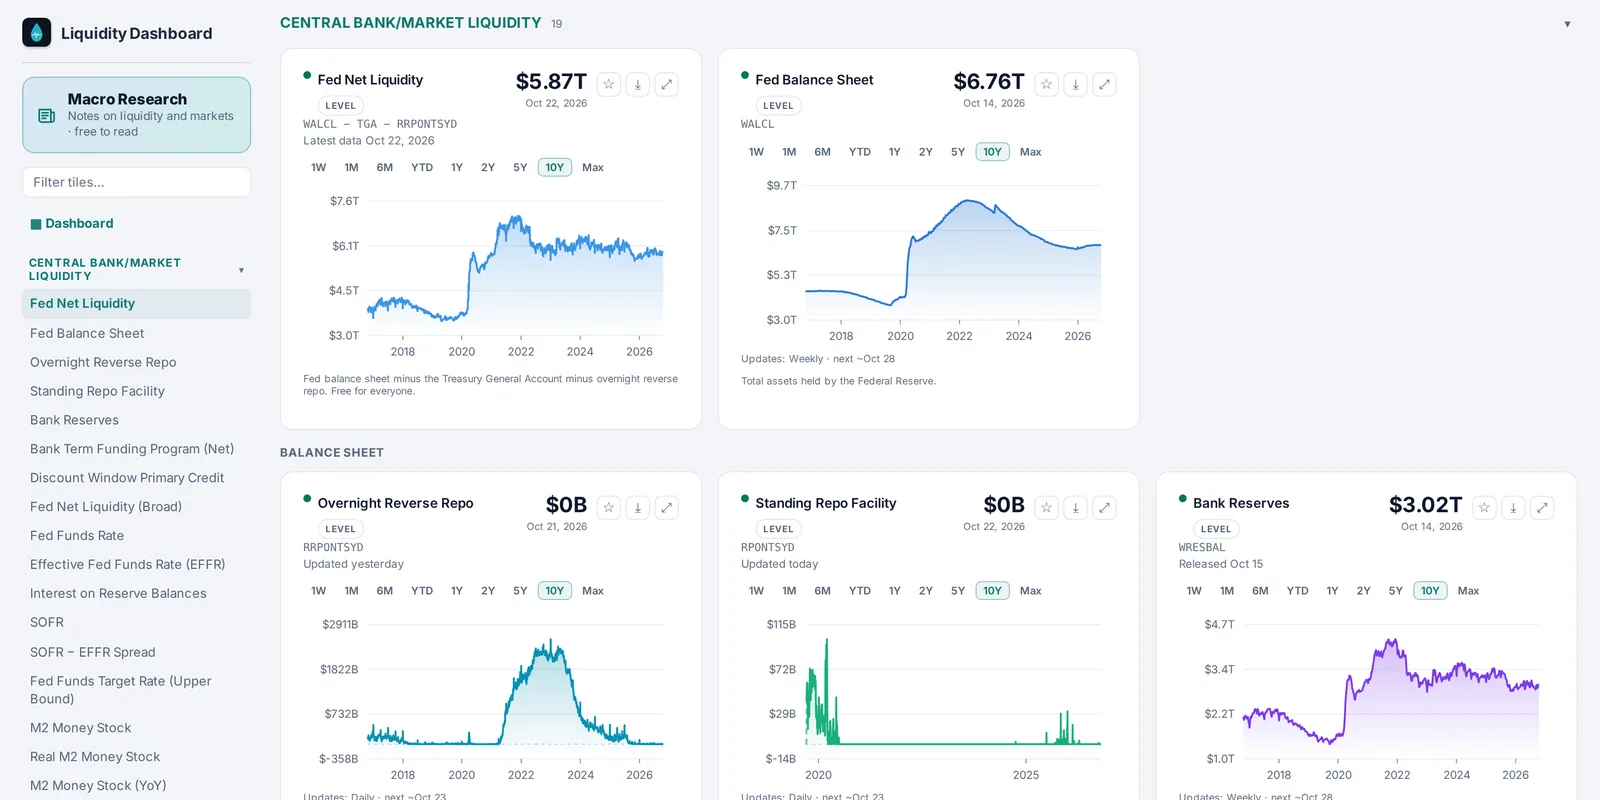
The Pro dashboard: live charts of the Fed balance sheet, reverse repo, bank reserves and other central bank data
Every chart on every tab: central banks, rates, credit, FX, volatility and oil, each with its latest release date.

Why not just use FRED? FRED is great for one series at a time. Pro puts 112 charts from 10 sources side by side, adds data FRED doesn’t have, and tells you when something moves.

Global Liquidity Index Free

Our daily estimate from 5 central banks plus G7 and China government debt, with Fed Net Liquidity.

One free chart on every tab Free

The Fed balance sheet, S&P 500, ECB assets, gilt and JGB yields, China GDP and Brent crude.

100+ macro charts Pro

Balance sheets, repo, M2, yields, credit spreads, FX, volatility and oil, with rate cuts, QE and QT marked.

CrossBorder Capital and Vortexa Pro

Global Liquidity Full and Flash, the Shadow Monetary Base and Collateral Multiplier, and Middle East oil exports.

Custom charts, alerts and webhooks Pro

Overlay any two series, save your charts, get an alert when a series moves, and send the latest data to your own systems.

Your charts in Claude and ChatGPT Pro

An MCP connector: ask about any chart in plain English and your AI app reads the data behind it. How to connect

Start 10-day free trial
AI Free, updated through the day

AI powered positioning assistant

Reads the 6-month trend in Global Liquidity and shows how liquidity-sensitive assets have moved.

Signal now
…

Loading the latest signal…

The signal is the 6-month change in our Global Liquidity Index: up more than 1% is an expansion zone, down more than 1% a contraction zone. The note’s first sentence comes straight from these numbers; an AI model writes the rest, and it is checked against the data before it is shown. General information, not financial advice.

Open the dashboard

Where the data comes from

Sources and attribution. Logos belong to their owners and don’t mean they endorse us.

Plans

Start free. Try Pro free for 10 days.

Free

$0 / forever
  • Global Liquidity Index and Fed Net Liquidity, no account needed
  • AI powered positioning assistant
  • One free chart on every tab
  • CSV and PNG export, light and dark themes
  • A free account gets the weekly note’s opening by email
Open the free dashboard

Institutional

Contact us
  • Everything in Pro, for a team
  • Faster refresh and priority support
  • Custom series and onboarding
Contact us

Prices in US dollars.

Not sure yet? Ask us anything. Book a free 30-minute call

Questions

What is global liquidity?

The pool of money and credit moving through the financial system. It grows when central banks expand their balance sheets and when governments issue more of the debt that banks use as collateral. Our index adds up the 5 biggest central banks and the government debt of the G7 and China, in US dollars.

How is the Global Liquidity Index built?

From public data only: the balance sheets of the Fed, the ECB, the Bank of Japan, the PBoC and the Bank of England, plus G7 and China government debt securities, converted to US dollars and smoothed over 4 weeks. See how it’s built.

How fresh is the data?

Each chart updates when its source publishes: market prices through the day, the Fed and the ECB weekly, most economic data monthly or quarterly. Every chart shows when it was last released, and new releases are listed at the top of the dashboard.

Can I use it in Claude or ChatGPT?

Yes. Pro includes an MCP connector: add https://liquiditydashboard.net/mcp/pro as a custom connector in Claude, ChatGPT or another app that supports MCP, sign in and approve it, then ask about any chart in plain English. It’s read-only and you can disconnect it any time. How to connect.

What happens when the free trial ends?

You add a card when you start, but nothing is charged for 10 days. We email you 3 days before the trial ends. If you don’t cancel, Pro then costs US$20 a month.

Can I cancel any time?

Yes. Go to Settings, then Billing & subscription, then Cancel. You keep Pro until the end of the period you’ve paid for, or the end of the trial, and you’re not charged again.

Is this financial advice?

No. Everything on the site is general information, including the positioning assistant. Data can be delayed, revised or wrong, so check important figures with the original source.

Something else? Email contact@liquiditydashboard.net or book a call.